Draw your own patch
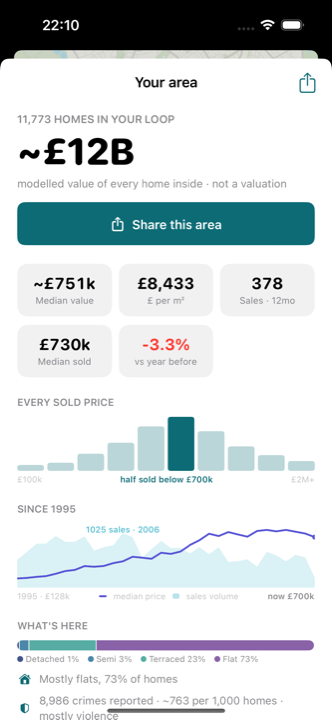
Lasso any shape on the map and get instant stats for exactly what you circled: homes, total value, every sold price, thirty years of history, what's selling. Then share it as a card that says it all.
What your budget buys
Drag a slider inside any lassoed area and read what share of the homes a figure covers: £500,000 buys 38% here, 74% two streets over. Built from modelled values for every home inside the loop.
Rooftop precision
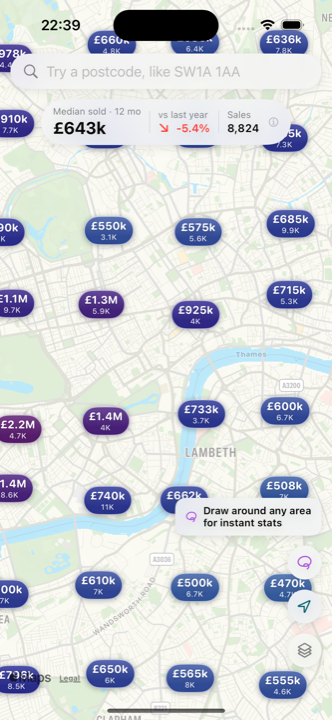
Pins sit on the homes they price, not on a postcode blob: 30 million sales since 1995, placed street by street, house by house.
£ per square metre
One tap turns the whole map into a price-density view, built from each home's recorded floor area. See what a pound actually buys, street by street.
Thirty years of history
Tap any home for every sale since 1995, area trends over 1 to 20 years, and a modelled estimate of what it's worth today. Scrub a timeline to watch prices move quarter by quarter since 1995.
Layers like a weather map
Price trends, rental yield and crime paint the map the way a weather radar paints rain. Zoom right in on the crime layer and the wash resolves into real street-level incident points.
Plot outlines
At full zoom the map draws indicative freehold extents around homes, a feel for where a plot sits. They are not legal title plans.